

Molecular filtering - Visualising Lipinskis Rule of Five
Posted on * • 9 minutes • 1722 words
Here we filter candidate drug molecules by Lipinsik’s rule of five to keep only orally bioavailable compounds.
ADME - absorption, distribution, metabolism, and excretion
ADMET is an acronym in pharmacology that stands for Absorption, Distribution, Metabolism, Excretion, and Toxicity. Pharmacokinetic studies and in vitro assays are commonly used to evaluate ADMET properties of new drug candidates. These are essential factors considered in drug development and pharmacokinetics:
- Absorption: Refers to the process by which a drug enters the bloodstream. It can occur through various routes such as oral ingestion, inhalation, injection, or topical application.
- Distribution: Once in the bloodstream, drugs distribute throughout the body. This involves how the drug is transported to different tissues and organs, including crossing barriers such as the blood-brain barrier.
- Metabolism: Metabolism involves the chemical transformation of the drug within the body, typically in the liver. Metabolism can alter the activity and toxicity of a drug and often results in the formation of metabolites, which may be pharmacologically active or inactive.
- Excretion: Excretion is the removal of drugs and their metabolites from the body, primarily through urine or feces via the kidneys and liver, respectively. Other routes of excretion include sweat, saliva, and breath.
- Toxicity: Toxicity refers to the potential of a drug to cause harm or adverse effects to the body. This can include acute toxicity (immediate adverse effects) or chronic toxicity (long-term adverse effects), and it is crucial to assess and mitigate potential risks during drug development.
Lipinski’s Rule of Five (Ro5)
Ro5 predicts the likelihood of a compound being orally bioavailable, which is closely related to its ADMET properties.
The rule was proposed by Christopher A. Lipinski in 1997 and states that:
- Molecular weight should be less than 500 daltons.
- The octanol-water partition coefficient (log P) should be less than 5.
- There should be no more than 5 hydrogen bond donors (e.g., OH or NH groups).
- There should be no more than 10 hydrogen bond acceptors (e.g., N or O atoms).
Compounds that violate more than one of these rules are less likely to be orally bioavailable, although there are exceptions and refinements to the rule.
Check the Ro5 validity for some compunds that are potent against EGFR
from pathlib import Path
import math

import numpy as np
import pandas as pd
import matplotlib.pyplot as plt
from matplotlib.lines import Line2D
import matplotlib.patches as mpatches
from rdkit import Chem
from rdkit.Chem import Descriptors, Draw, PandasTools
Load Data
molecules = pd.read_csv("./EGFR_compounds.csv", index_col=0)
molecules.head()
| molecule_chembl_id | IC50 | units | smiles | pIC50 | |
|---|---|---|---|---|---|
| 0 | CHEMBL63786 | 0.003 | nM | Brc1cccc(Nc2ncnc3cc4ccccc4cc23)c1 | 11.522879 |
| 1 | CHEMBL35820 | 0.006 | nM | CCOc1cc2ncnc(Nc3cccc(Br)c3)c2cc1OCC | 11.221849 |
| 2 | CHEMBL53711 | 0.006 | nM | CN(C)c1cc2c(Nc3cccc(Br)c3)ncnc2cn1 | 11.221849 |
| 3 | CHEMBL66031 | 0.008 | nM | Brc1cccc(Nc2ncnc3cc4[nH]cnc4cc23)c1 | 11.096910 |
| 4 | CHEMBL53753 | 0.008 | nM | CNc1cc2c(Nc3cccc(Br)c3)ncnc2cn1 | 11.096910 |
Function to calculate Ro5
def calculate_ro5_properties(smiles):
    """
    Test if input molecule (SMILES) fulfills Lipinski's rule of five.

    Returns:    pandas.Series
        Molecular weight, number of hydrogen bond acceptors/donor and logP value
        and Lipinski's rule of five compliance for input molecule.
    """
    # RDKit molecule from SMILES
    molecule = Chem.MolFromSmiles(smiles)
    # Calculate Ro5-relevant chemical properties
    molecular_weight = Descriptors.ExactMolWt(molecule)
    n_hba = Descriptors.NumHAcceptors(molecule)
    n_hbd = Descriptors.NumHDonors(molecule)
    logp = Descriptors.MolLogP(molecule)
    # Check if Ro5 conditions fulfilled
    conditions = [molecular_weight <= 500, n_hba <= 10, n_hbd <= 5, logp <= 5]
    ro5_fulfilled = sum(conditions) >= 3
    # Return True if no more than one out of four conditions is violated
    return pd.Series(
        [molecular_weight, n_hba, n_hbd, logp, ro5_fulfilled],
        index=["molecular_weight", "n_hba", "n_hbd", "logp", "ro5_fulfilled"],
    )
# apply to Smiles
ro5_properties = molecules["smiles"].apply(calculate_ro5_properties)
ro5_properties.head()
| molecular_weight | n_hba | n_hbd | logp | ro5_fulfilled | |
|---|---|---|---|---|---|
| 0 | 349.021459 | 3 | 1 | 5.2891 | True |
| 1 | 387.058239 | 5 | 1 | 4.9333 | True |
| 2 | 343.043258 | 5 | 1 | 3.5969 | True |
| 3 | 339.011957 | 4 | 2 | 4.0122 | True |
| 4 | 329.027607 | 5 | 2 | 3.5726 | True |
Split dataframe on Molecules that fulfil or violate Ro5
# Concatenate molecules with Ro5 data
molecules = pd.concat([molecules, ro5_properties], axis=1)
molecules.loc[:,['molecule_chembl_id', 'smiles', 'ro5_fulfilled']].head()
| molecule_chembl_id | smiles | ro5_fulfilled | |
|---|---|---|---|
| 0 | CHEMBL63786 | Brc1cccc(Nc2ncnc3cc4ccccc4cc23)c1 | True |
| 1 | CHEMBL35820 | CCOc1cc2ncnc(Nc3cccc(Br)c3)c2cc1OCC | True |
| 2 | CHEMBL53711 | CN(C)c1cc2c(Nc3cccc(Br)c3)ncnc2cn1 | True |
| 3 | CHEMBL66031 | Brc1cccc(Nc2ncnc3cc4[nH]cnc4cc23)c1 | True |
| 4 | CHEMBL53753 | CNc1cc2c(Nc3cccc(Br)c3)ncnc2cn1 | True |
molecules_ro5_fulfilled = molecules[molecules["ro5_fulfilled"]]
molecules_ro5_violated = molecules[~molecules["ro5_fulfilled"]]
molecules_ro5_violated.head()
| molecule_chembl_id | IC50 | units | smiles | pIC50 | molecular_weight | n_hba | n_hbd | logp | ro5_fulfilled | |
|---|---|---|---|---|---|---|---|---|---|---|
| 13 | CHEMBL180022 | 0.08 | nM | CCOc1cc2ncc(C#N)c(Nc3ccc(OCc4ccccn4)c(Cl)c3)c2... | 10.096910 | 556.198966 | 8 | 2 | 5.93248 | False |
| 32 | CHEMBL3753235 | 0.20 | nM | C=CC(=O)Nc1cccc(-n2c(=O)c(-c3ccccc3)cc3cnc(Nc4... | 9.698970 | 587.264488 | 9 | 2 | 5.07620 | False |
| 49 | CHEMBL2029438 | 0.29 | nM | C=CC(=O)Nc1cccc(N2C(=O)N(Cc3ccccc3)Cc3cnc(Nc4c... | 9.537602 | 604.291037 | 8 | 2 | 5.37900 | False |
| 55 | CHEMBL4078431 | 0.30 | nM | COc1cc2ncnc(Nc3cccc(Br)c3)c2cc1OCCCOP(N)(=O)N(... | 9.522879 | 605.036108 | 7 | 2 | 5.77640 | False |
| 56 | CHEMBL4127317 | 0.30 | nM | C=CC(=O)Nc1cccc(-n2c(=O)n(C(C)C)c(=O)c3cnc(Nc4... | 9.522879 | 570.270302 | 11 | 2 | 3.15180 | False |
Calculate Stats for the df that obey or violate Ro5
def calculate_mean_std(dataframe):
    """
    Calculate the mean and standard deviation of a dataset.

    Parameters
    ----------
    dataframe : pd.DataFrame
        Properties (columns) for a set of items (rows).

    Returns
    -------
    pd.DataFrame
        Mean and standard deviation (columns) for different properties (rows).
    """
    # Generate descriptive statistics for property columns
    stats = dataframe.describe()
    # Transpose DataFrame (statistical measures = columns)
    stats = stats.T
    # Select mean and standard deviation
    stats = stats[["mean", "std"]]
    return stats
# calculate the statistic for the dataset of compounds
molecules_ro5_fulfilled_stats = calculate_mean_std(
    molecules_ro5_fulfilled[["molecular_weight", "n_hba", "n_hbd", "logp"]]
)
molecules_ro5_violated_stats = calculate_mean_std(
    molecules_ro5_violated[["molecular_weight", "n_hba", "n_hbd", "logp"]]
)
molecules_ro5_violated_stats
| mean | std | |
|---|---|---|
| molecular_weight | 587.961963 | 101.999229 |
| n_hba | 7.963558 | 2.373576 |
| n_hbd | 2.301179 | 1.719732 |
| logp | 5.973461 | 1.430636 |
molecules_ro5_fulfilled_stats
| mean | std | |
|---|---|---|
| molecular_weight | 414.439011 | 87.985100 |
| n_hba | 5.996548 | 1.875491 |
| n_hbd | 1.889968 | 1.008368 |
| logp | 4.070568 | 1.193034 |
Visualize Ro5 properties (radar plot)
Scale Y-values
# Scale the values for easy plotting.
# The MWT has a threshold of 500,
# whereas the number of HBAs and HBDs and the LogP have thresholds of only 10, 5, and 5.
# In order to visualize these different scales most simplistically,
# we will scale all property values to a scaled threshold = 5:

# scaled property value = property value / property threshold * scaled property threshold

def _scale_by_thresholds(stats, thresholds, scaled_threshold):
    """
    Scale values for different properties that have each an individually defined threshold.

    Parameters
    ----------
    stats : pd.DataFrame
        Dataframe with "mean" and "std" (columns) for each physicochemical property (rows).
    thresholds : dict of str: int
        Thresholds defined for each property.
    scaled_threshold : int or float
        Scaled thresholds across all properties.

    Returns
    -------
    pd.DataFrame
        DataFrame with scaled means and standard deviations for each physiochemical property.
    """
    # Raise error if scaling keys and data_stats indicies are not matching
    for property_name in stats.index:
        if property_name not in thresholds.keys():
            raise KeyError(f"Add property '{property_name}' to scaling variable.")
    # Scale property data
    stats_scaled = stats.apply(lambda x: x / thresholds[x.name] * scaled_threshold, axis=1)
    return stats_scaled
Scale Xvalues to radians
def _define_radial_axes_angles(n_axes):
    """Define angles (radians) for radial (x-)axes depending on the number of axes."""
    x_angles = [i / float(n_axes) * 2 * math.pi for i in range(n_axes)]
    x_angles += x_angles[:1]
    return x_angles
thresholds = {"molecular_weight": 500, "n_hba": 10, "n_hbd": 5, "logp": 5}
scaled_threshold = 5
properties_labels = [
    "Molecular weight (Da) / 100",
    "# HBA / 2",
    "# HBD",
    "LogP",
]
y_max = 8
Plotter function
def plot_radar(
    y,
    thresholds,
    scaled_threshold,
    properties_labels,
    y_max=None,
    output_path=None,
):
    """
    Plot a radar chart based on the mean and standard deviation of a data set's properties.

    Parameters
    ----------
    y : pd.DataFrame
        Dataframe with "mean" and "std" (columns) for each physicochemical property (rows).
    thresholds : dict of str: int
        Thresholds defined for each property.
    scaled_threshold : int or float
        Scaled thresholds across all properties.
    properties_labels : list of str
        List of property names to be used as labels in the plot.
    y_max : None or int or float
        Set maximum y value. If None, let matplotlib decide.
    output_path : None or pathlib.Path
        If not None, save plot to file.
    """

    # Define radial x-axes angles -- uses our helper function!
    x = _define_radial_axes_angles(len(y))
    # Scale y-axis values with respect to a defined threshold -- uses our helper function!
    y = _scale_by_thresholds(y, thresholds, scaled_threshold)
    # Since our chart will be circular we append the first value of each property to the end
    y = pd.concat([y, y.head(1)])

    # Set figure and subplot axis
    plt.figure(figsize=(6, 6))
    ax = plt.subplot(111, polar=True)

    # Plot data
    ax.fill(x, [scaled_threshold] * len(x), "cornflowerblue", alpha=0.2)
    ax.plot(x, y["mean"], "b", lw=3, ls="-")
    ax.plot(x, y["mean"] + y["std"], "orange", lw=2, ls="--")
    ax.plot(x, y["mean"] - y["std"], "orange", lw=2, ls="-.")

    # From here on, we only do plot cosmetics
    # Set 0° to 12 o'clock
    ax.set_theta_offset(math.pi / 2)
    # Set clockwise rotation
    ax.set_theta_direction(-1)

    # Set y-labels next to 180° radius axis
    ax.set_rlabel_position(180)
    # Set number of radial axes' ticks and remove labels
    plt.xticks(x, [])
    # Get maximal y-ticks value
    if not y_max:
        y_max = int(ax.get_yticks()[-1])
    # Set axes limits
    plt.ylim(0, y_max)
    # Set number and labels of y axis ticks
    plt.yticks(
        range(1, y_max),
        ["5" if i == scaled_threshold else "" for i in range(1, y_max)],
        fontsize=16,
    )

    # Draw ytick labels to make sure they fit properly
    # Note that we use [:1] to exclude the last element which equals the first element (not needed here)
    for i, (angle, label) in enumerate(zip(x[:-1], properties_labels)):
        if angle == 0:
            ha = "center"
        elif 0 < angle < math.pi:
            ha = "left"
        elif angle == math.pi:
            ha = "center"
        else:
            ha = "right"
        ax.text(
            x=angle,
            y=y_max + 1,
            s=label,
            size=16,
            horizontalalignment=ha,
            verticalalignment="center",
        )

    # Add legend relative to top-left plot
    labels = ("rule of five area", "mean", "mean - std", "mean + std")
    ax.legend(labels, loc=(1.1, 0.7), labelspacing=0.3, fontsize=16)

    # Save plot - use bbox_inches to include text boxes
    if output_path:
        plt.savefig(output_path, dpi=100, bbox_inches="tight", transparent=True)

    plt.show()
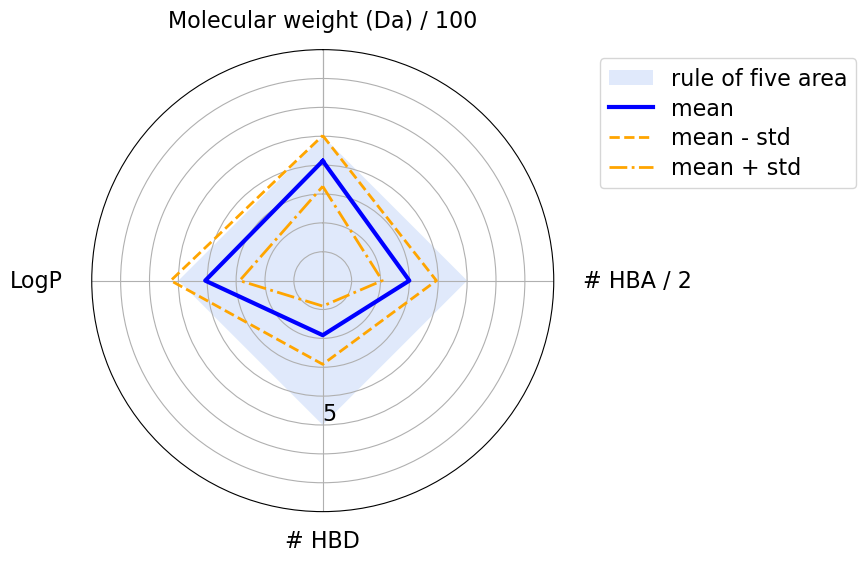
Compounds that obey Ro5
plot_radar(
    molecules_ro5_fulfilled_stats,
    thresholds,
    scaled_threshold,
    properties_labels,
    y_max,
)
# The light blue shaded area is region where a molecule’s physicochemical properties are compliant with the Ro5.
# For Ro5 compliant mean is in area, while some have std out of shaded region.
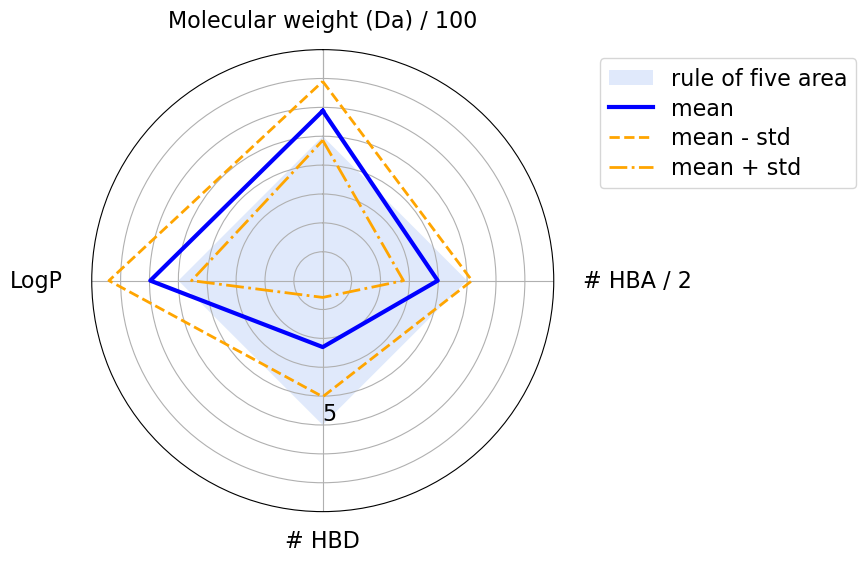
Compounds that violate Ro5
plot_radar(
    molecules_ro5_violated_stats,
    thresholds,
    scaled_threshold,
    properties_labels,
    y_max,
)
Reference Talktorial - T002 by Volkamers Lab